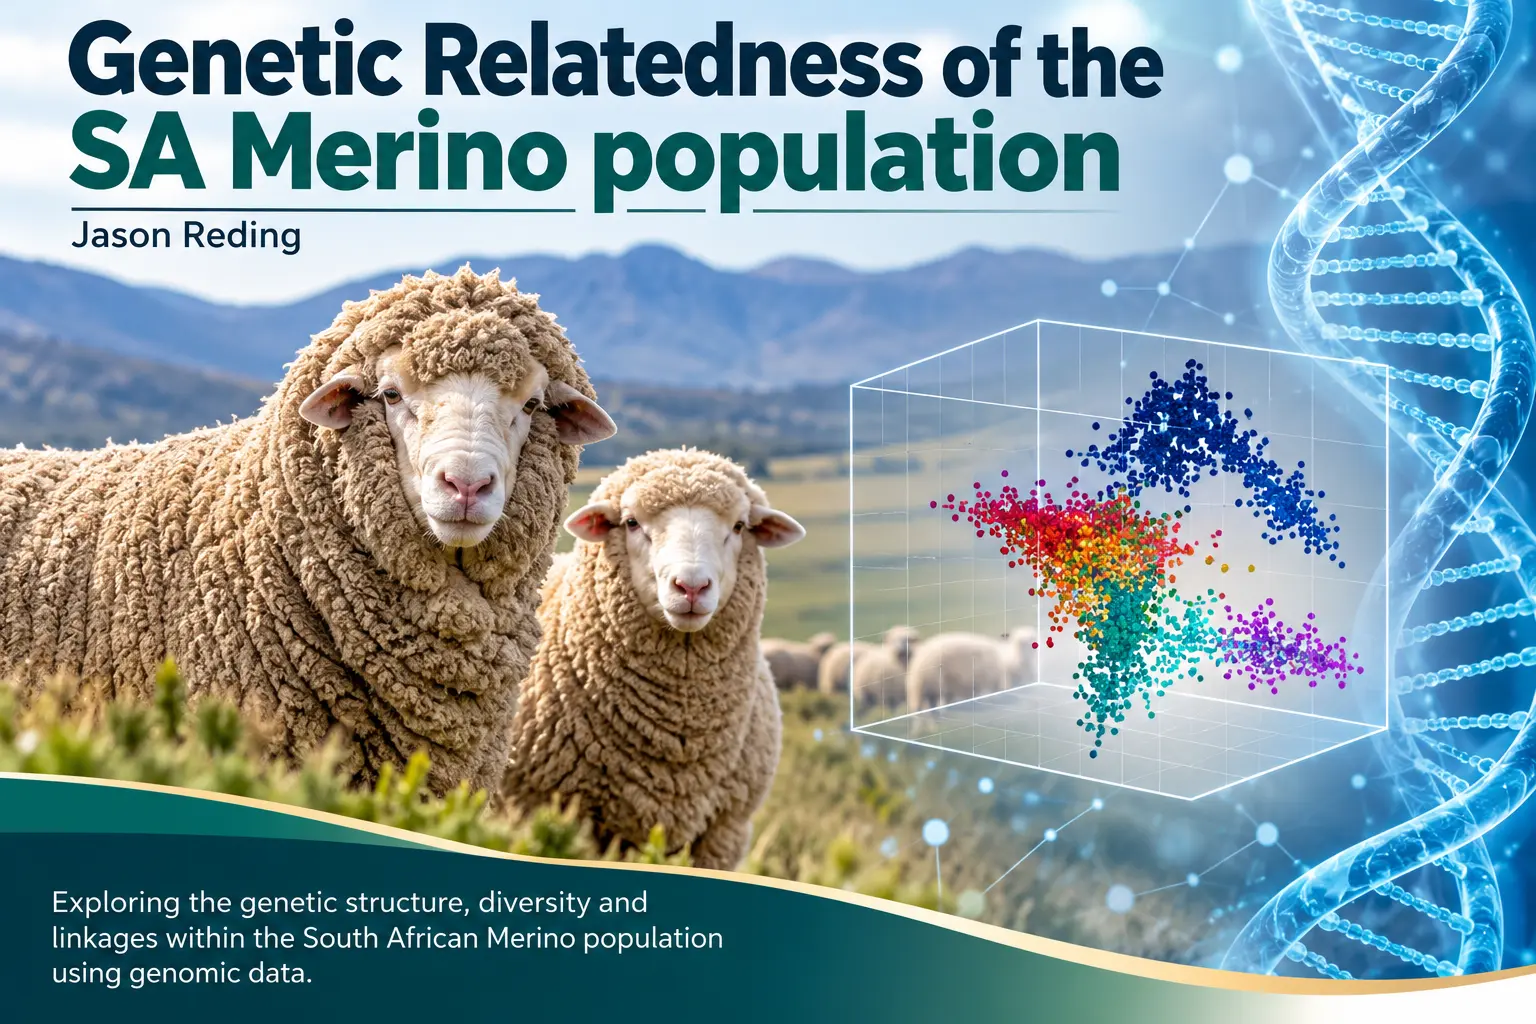
Genomics provides a new perspective on the genetic diversity and relatedness of South African Merino sheep. Using three-dimensional Genebox visualisations of approximately 3,250 animals from more than 30 flocks, Jason Reding demonstrates how genomic data reveal shared ancestry, genetic differences between flocks, and the effects of breeding practices. The article also highlights practical applications of genomics for improving adaptation, fertility and disease resistance.
Download this publication
PDF · 172 KB · 1 download
From the document
Genetic Relatedness of the SA Merino population Jason Reding Introduction
enomics in livestock has made tremendous advances in recent years. The ability to capture an animal’s unique DNA sequence has become a cornerstone of stud breeding in the local and international community. Over 60 000 DNA markers, called single nucleotide polymorphisms (SNPs), are analysed on a genomic chip (genotype) and is sometimes referred to as an “All in One” DNA test. The use of genomic information in small stock genetic evaluations has a large impact on increasing the prediction accuracy of production and fertility traits that are lowly heritable, sex-limited and are only measured later in life (Berry et al., 2014; Van Marle-Köster & Visser, 2018). Although this aspect of genomics may be limited to breed societies with routine genetic evaluations, there are other vital use cases that should not be overlooked by commercial and informal livestock breeders.
Genebox A three-dimensional Genebox can reveal the true depth of genetic variation between animals within the same breed, and the corresponding flock to which they belong to. Each dot is representative of a single animals’ genotype, with animals from the same flocks clustering together. A larger cluster indicates a larger amount of genetic variation while flocks that cluster closer together have shared ancestry. It must be noted that the Genebox and genetic spread of the animals is determined by the number of animals placed in the analysis, the number of genetically different flocks, as well as the type of animals within the SA Merino population, e.g. strong wool vs fine wool selection practices.
Whole Genomic Population The following Genebox includes the total SA Merino genomic population comprising of around 3 250 animals from over 30 different flocks. The Grootfontein Strong-Wool Flock (dark blue) shows a distinct separation from the Industry Flocks (multiple colours), indicating that these are genetically different from the animals genotyped from Industry Flocks (Picture 1). The tight clustering of the Industry Flocks points to the fact that these breeders are selecting for similar types of genetics. As the Genebox is 3-dimensional, rotating it allows for different perspectives of the genetic spread these animals have. Picture 2 shows the Grootfontein FineWool Flock (light blue) to be rooted at the bottom of the box, with a clear separation between the industry animals and the Grootfontein StrongWool Flock.
The opening of the PDF. Download it above for the full document.